Institutions are Guzzling Bitcoin
The Bullish Bitcoin and equities case

Since last issue institutions have gone berserk and are now buying up 577% of the daily mined Bitcoin supply. That’s huge. Bitcoin is up 12%.
Have we reached local euphoria?
Or is this just the beginning of a bigger Bitcoin rally?
This issue we deep dive Bitcoin and equities.
BITCOIN
Tl;dr:
Bitcoin is bullish across on-chain and technical data. We restate what we wrote last issue “amongst this swathe of data (and more) it’s hard not to be bullish”
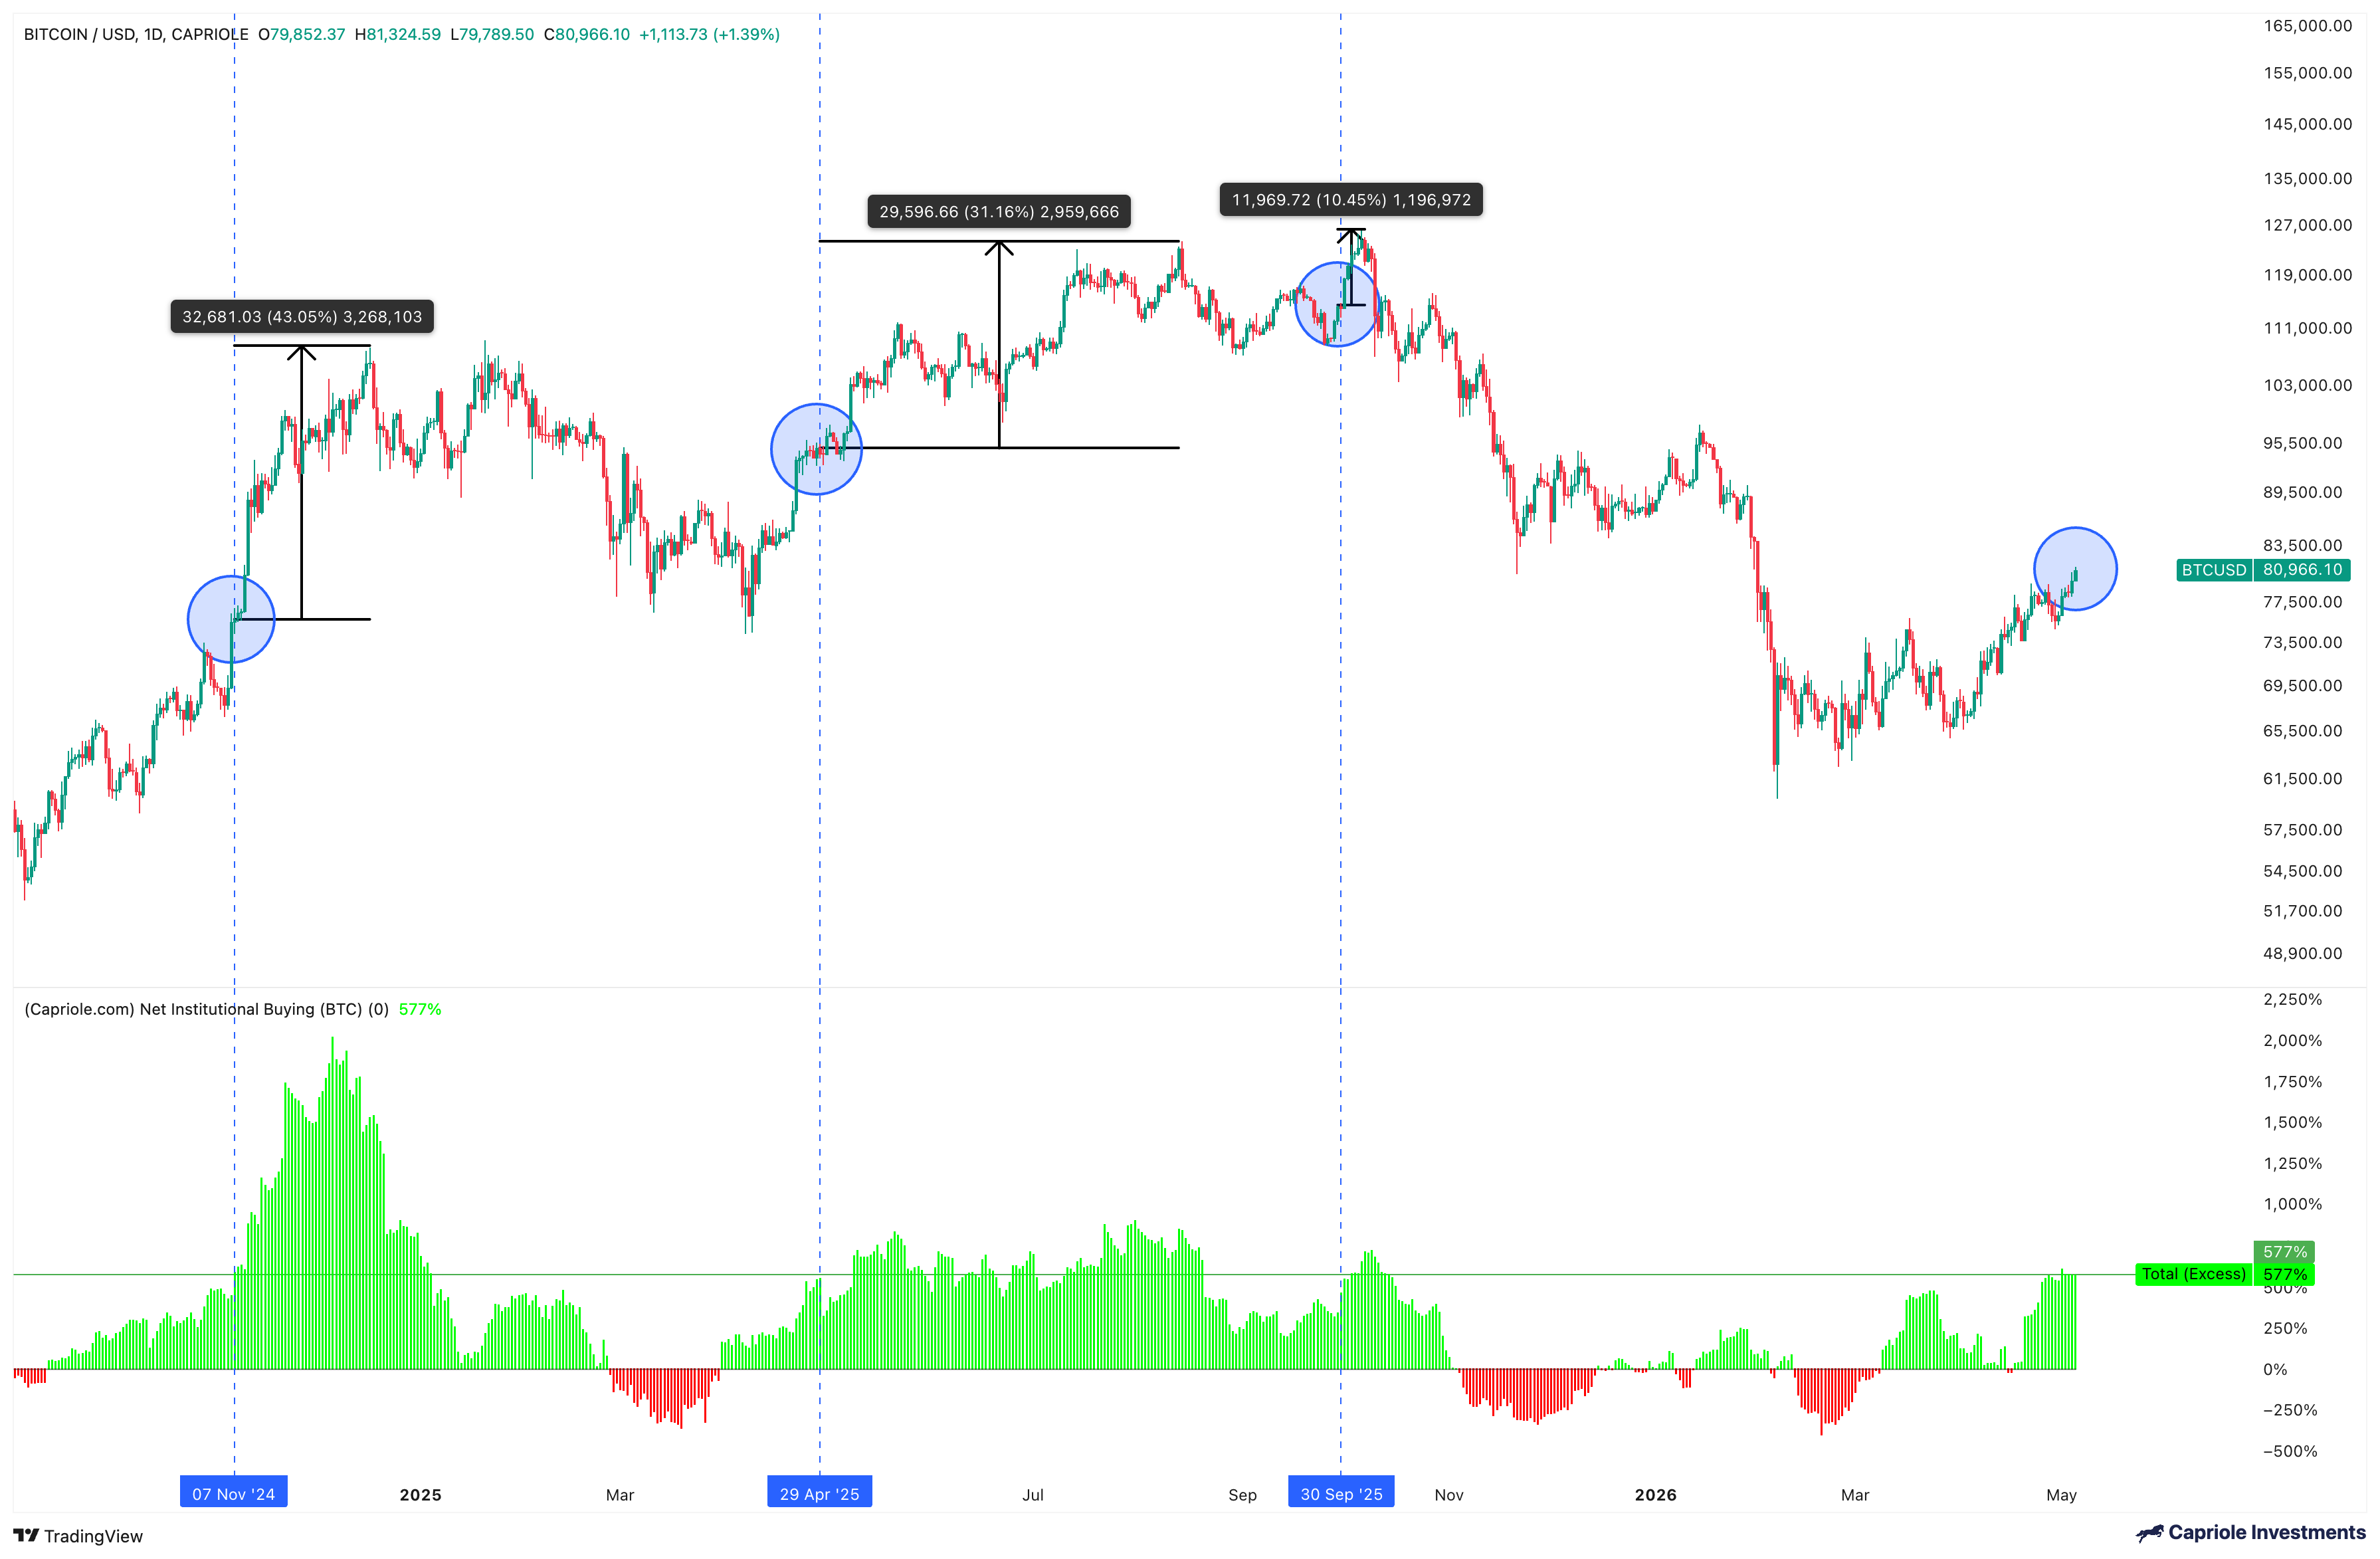
Institutions are buying up 600% of daily mined supply
Capriole’s longest running on-chain and technical models are both long from $71K
Complete capitulation on derivatives markets occured in March/April
Capitulation and bullish breakout on SOPR.
Institutional Bitcoin Bid
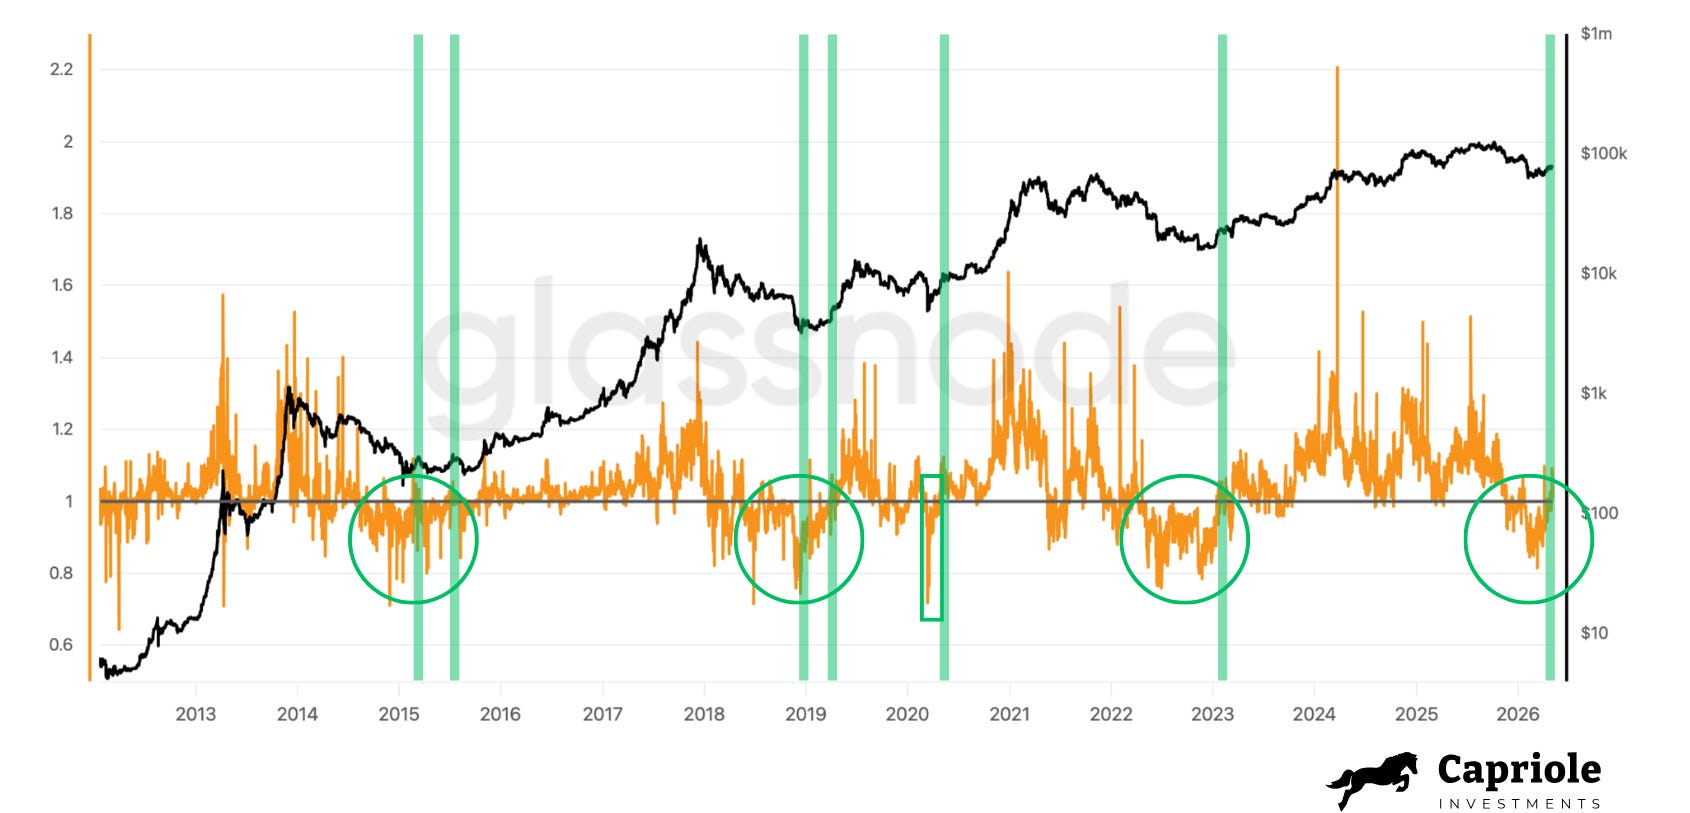
Institutions are slurping up 600%+ of Bitcoin's daily mined supply. Every time it's been this high before, price has shot up over the next week. As the chart shows, we’ve typically seen double digit returns from here with a couple of weeks in all prior cases. That would take us to around $96K.
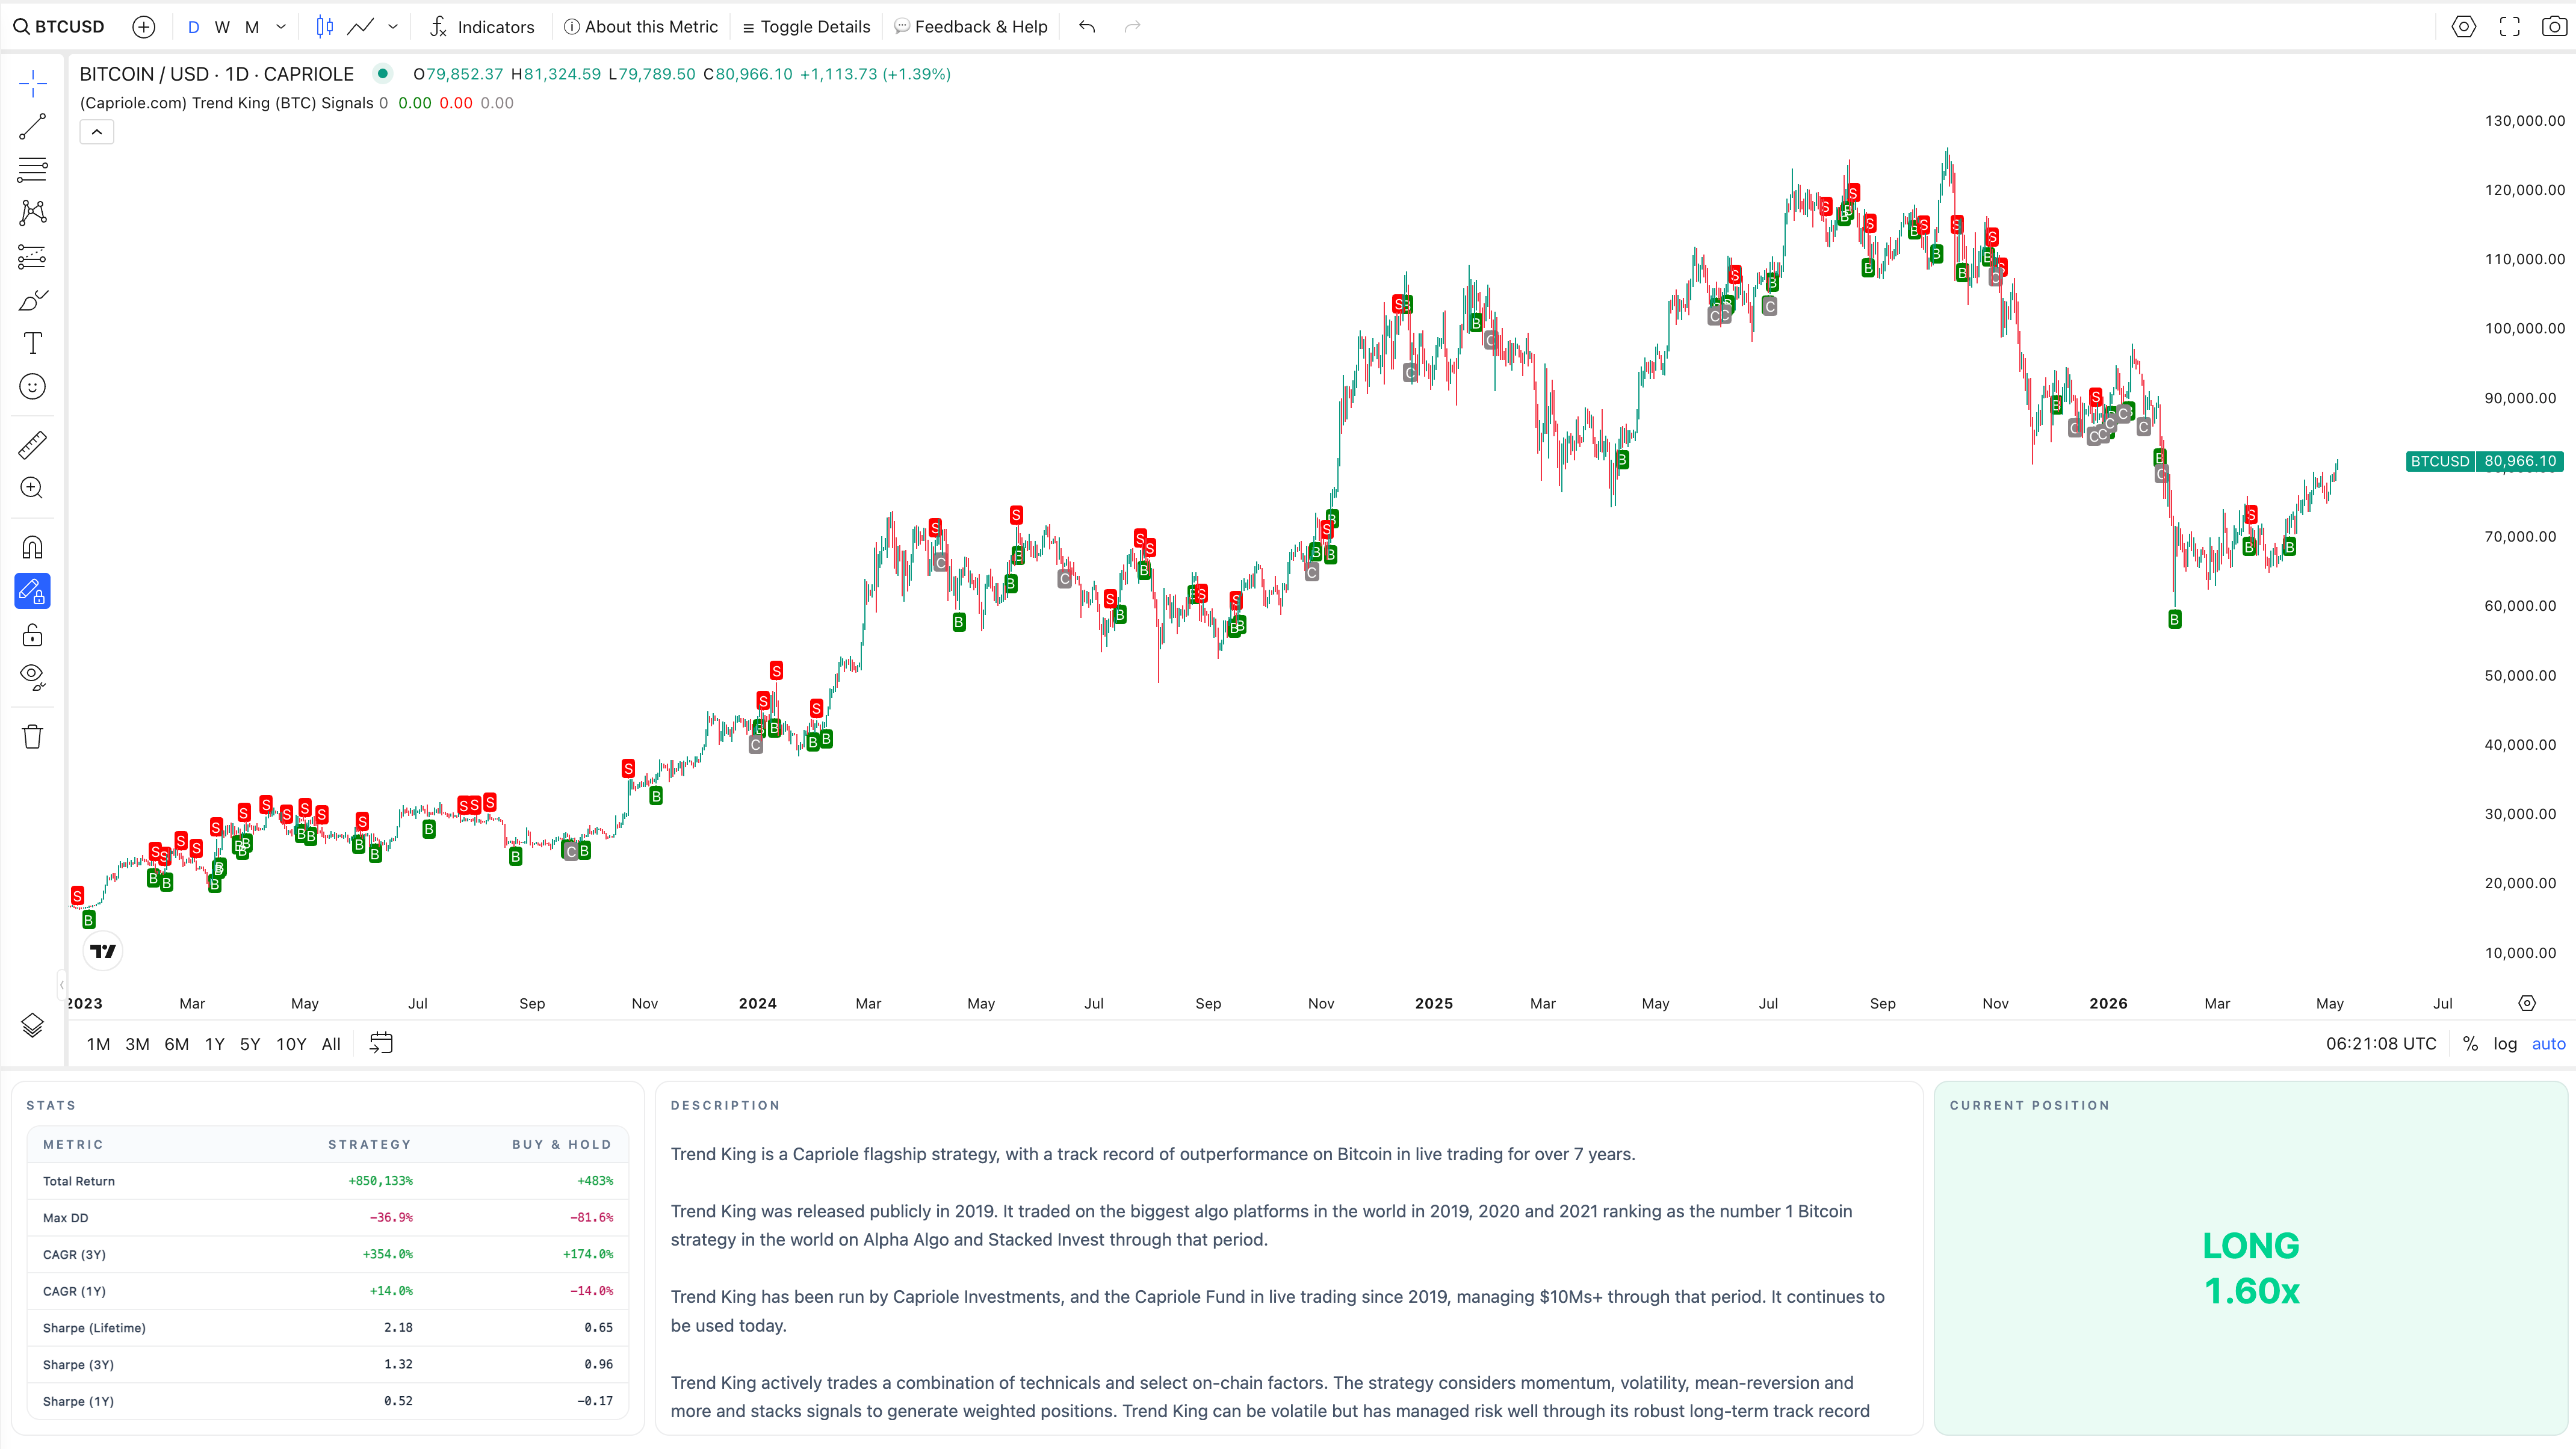
Trend King is leverage long Bitcoin
Trend King is our longest running live trading strategy, publicly released in 2019 and managing funds non-stop since. Trend King was ranked the No 1 Bitcoin strategy in the world in 2019, 2020 and 2021 while it was publicly listed on the biggest algo trading platforms at the time. It’s now public again for the first time since 2021. Trend King is primarily a technical strategy, but also looks at select on-chain factors. Trend King is currently leverage long Bitcoin.
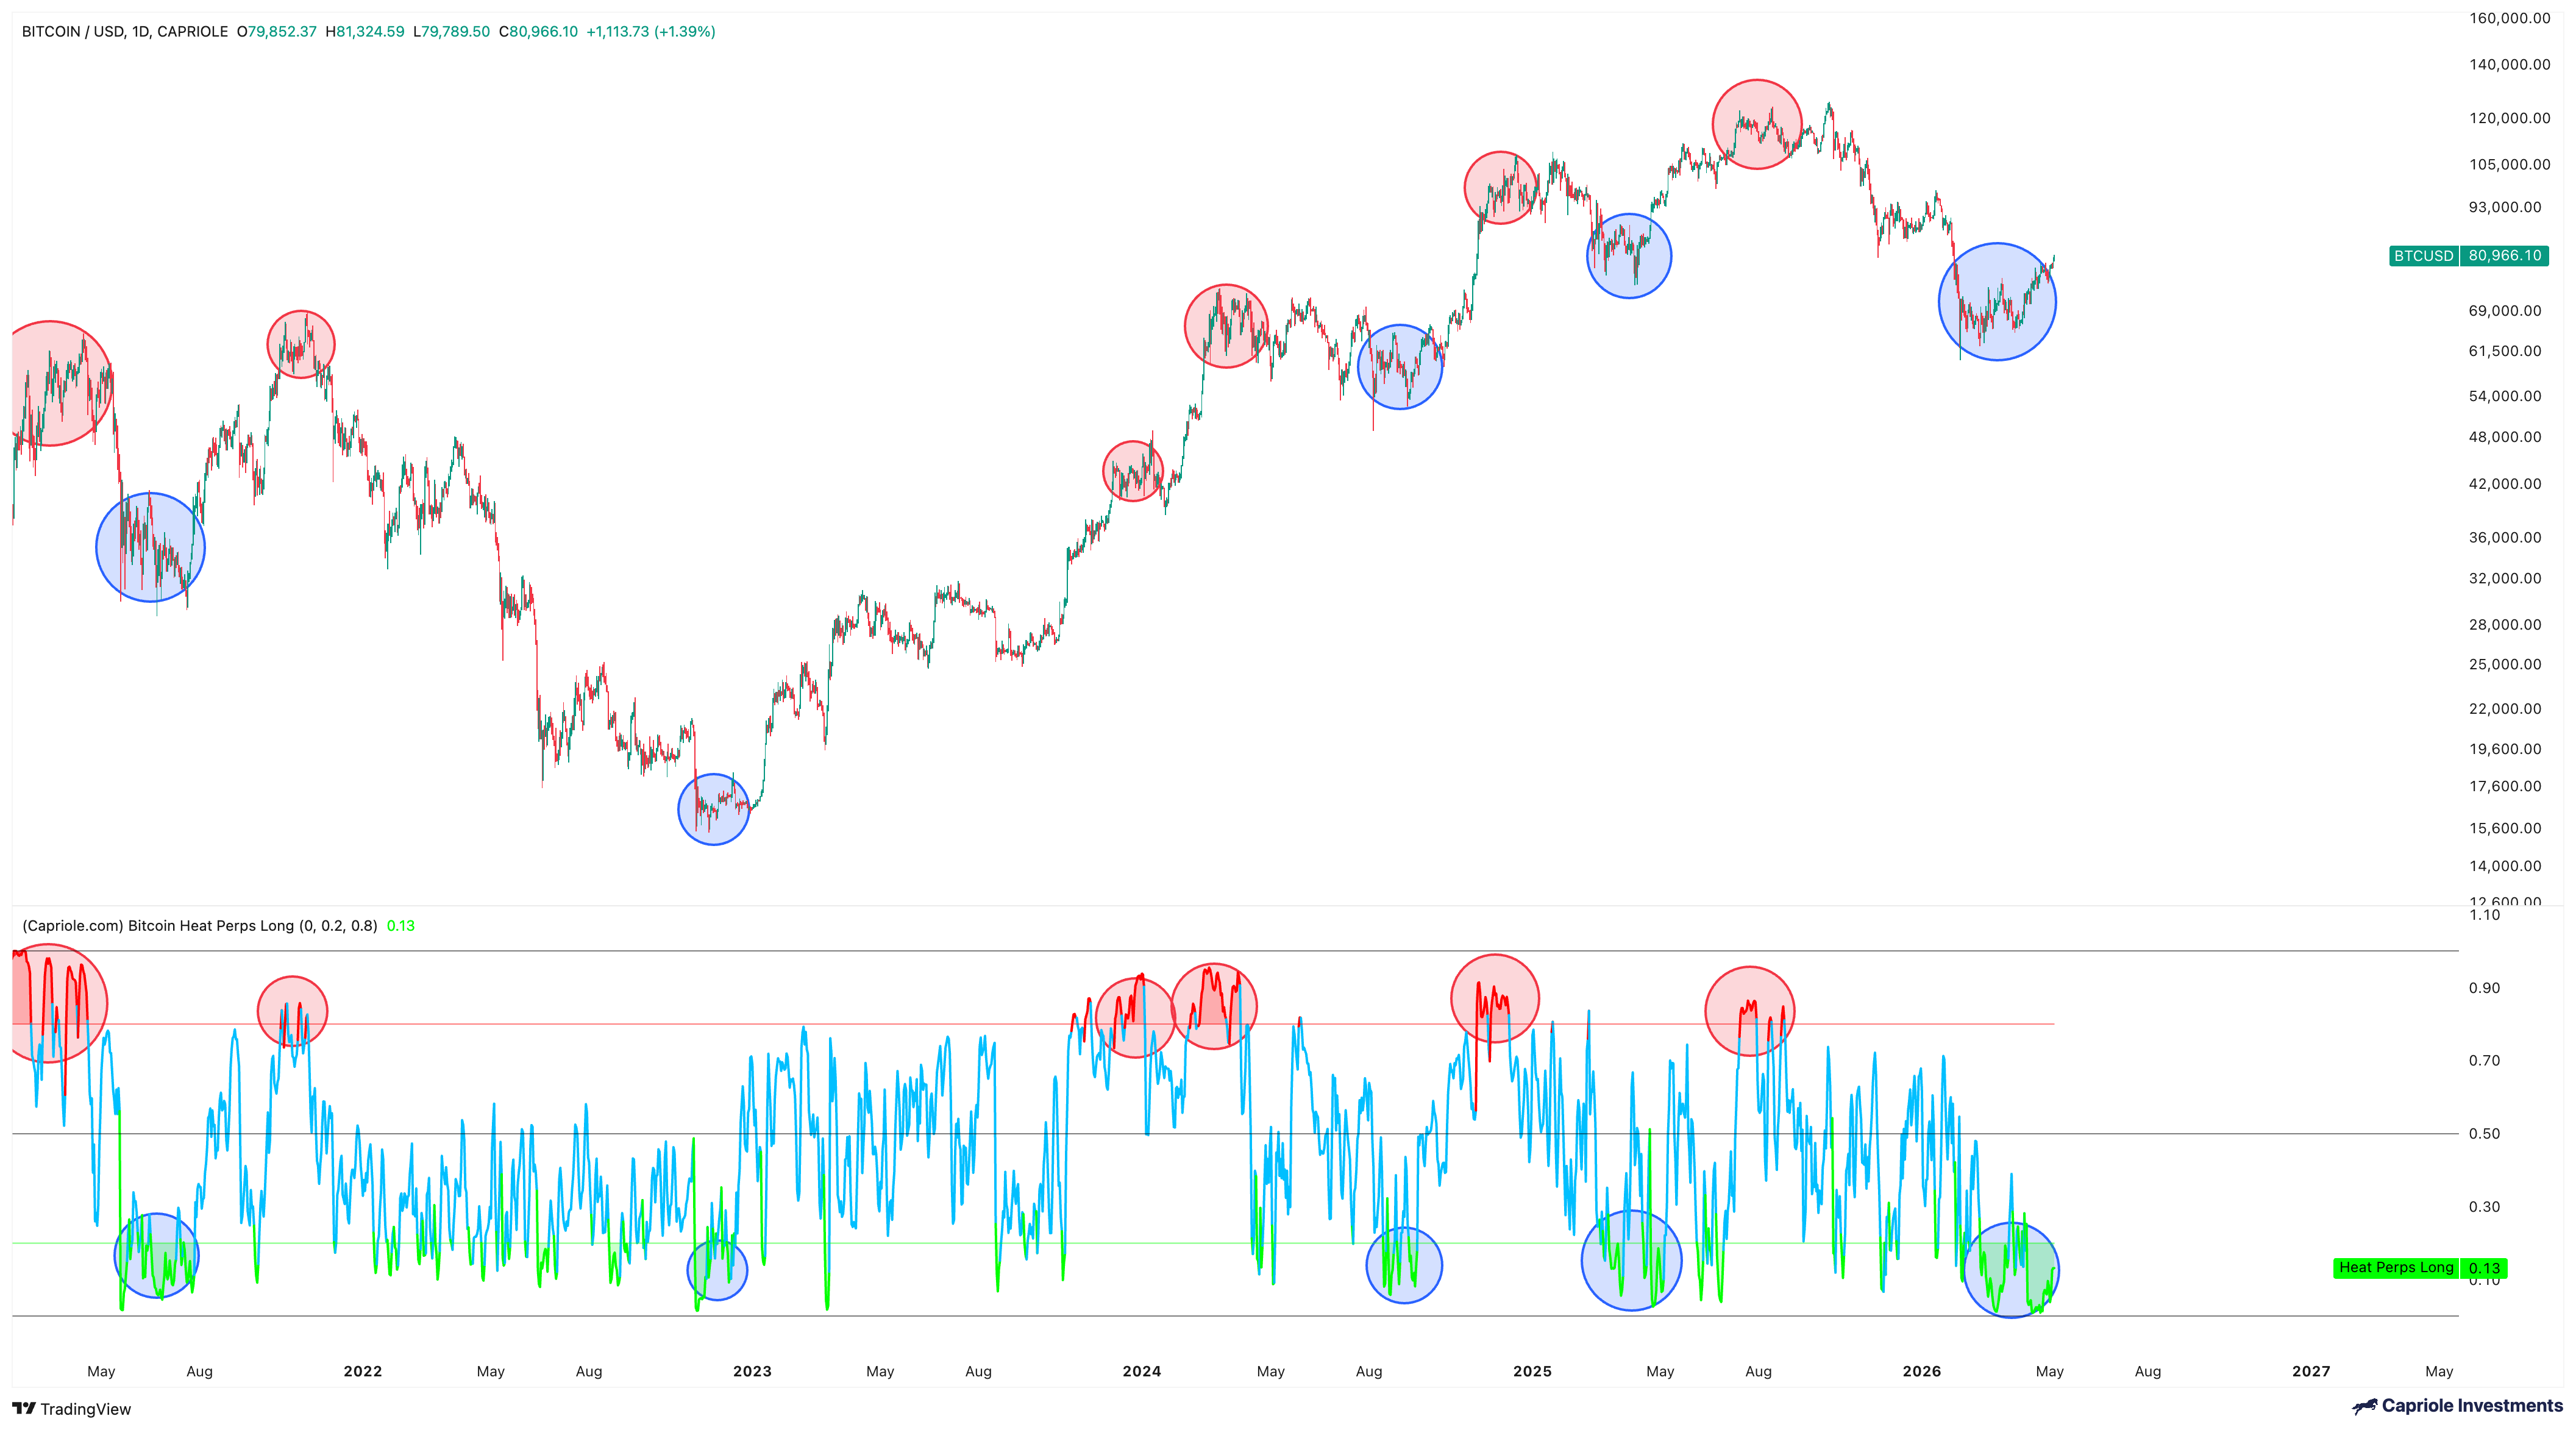
Bitcoin Perps Heat tracks the long-term relative extremity in Bitcoin’s 2nd biggest derivatives market, Bitcoin Perpetual Swaps. By looking at funding rates and open interest and normalizing over a 4 year period. When it’s relatively high, many are long Bitcoin. When it’s low, many are short Bitcoin. It’s important to look for regimes of extended periods in long-term high/low zones (see below bubbles). We’ve just had an extremely bullish long term signal for Perps Heat amidst excessive shorting.
Last issue we talked about Spent Output Profit Ratio (SOPR) spending significant periods below 1 being “great Bitcoin opportunities in the past”. This issue we also have bullish confirmation with the close back above 1. A good sign of a return of positive price and onchain momentum.
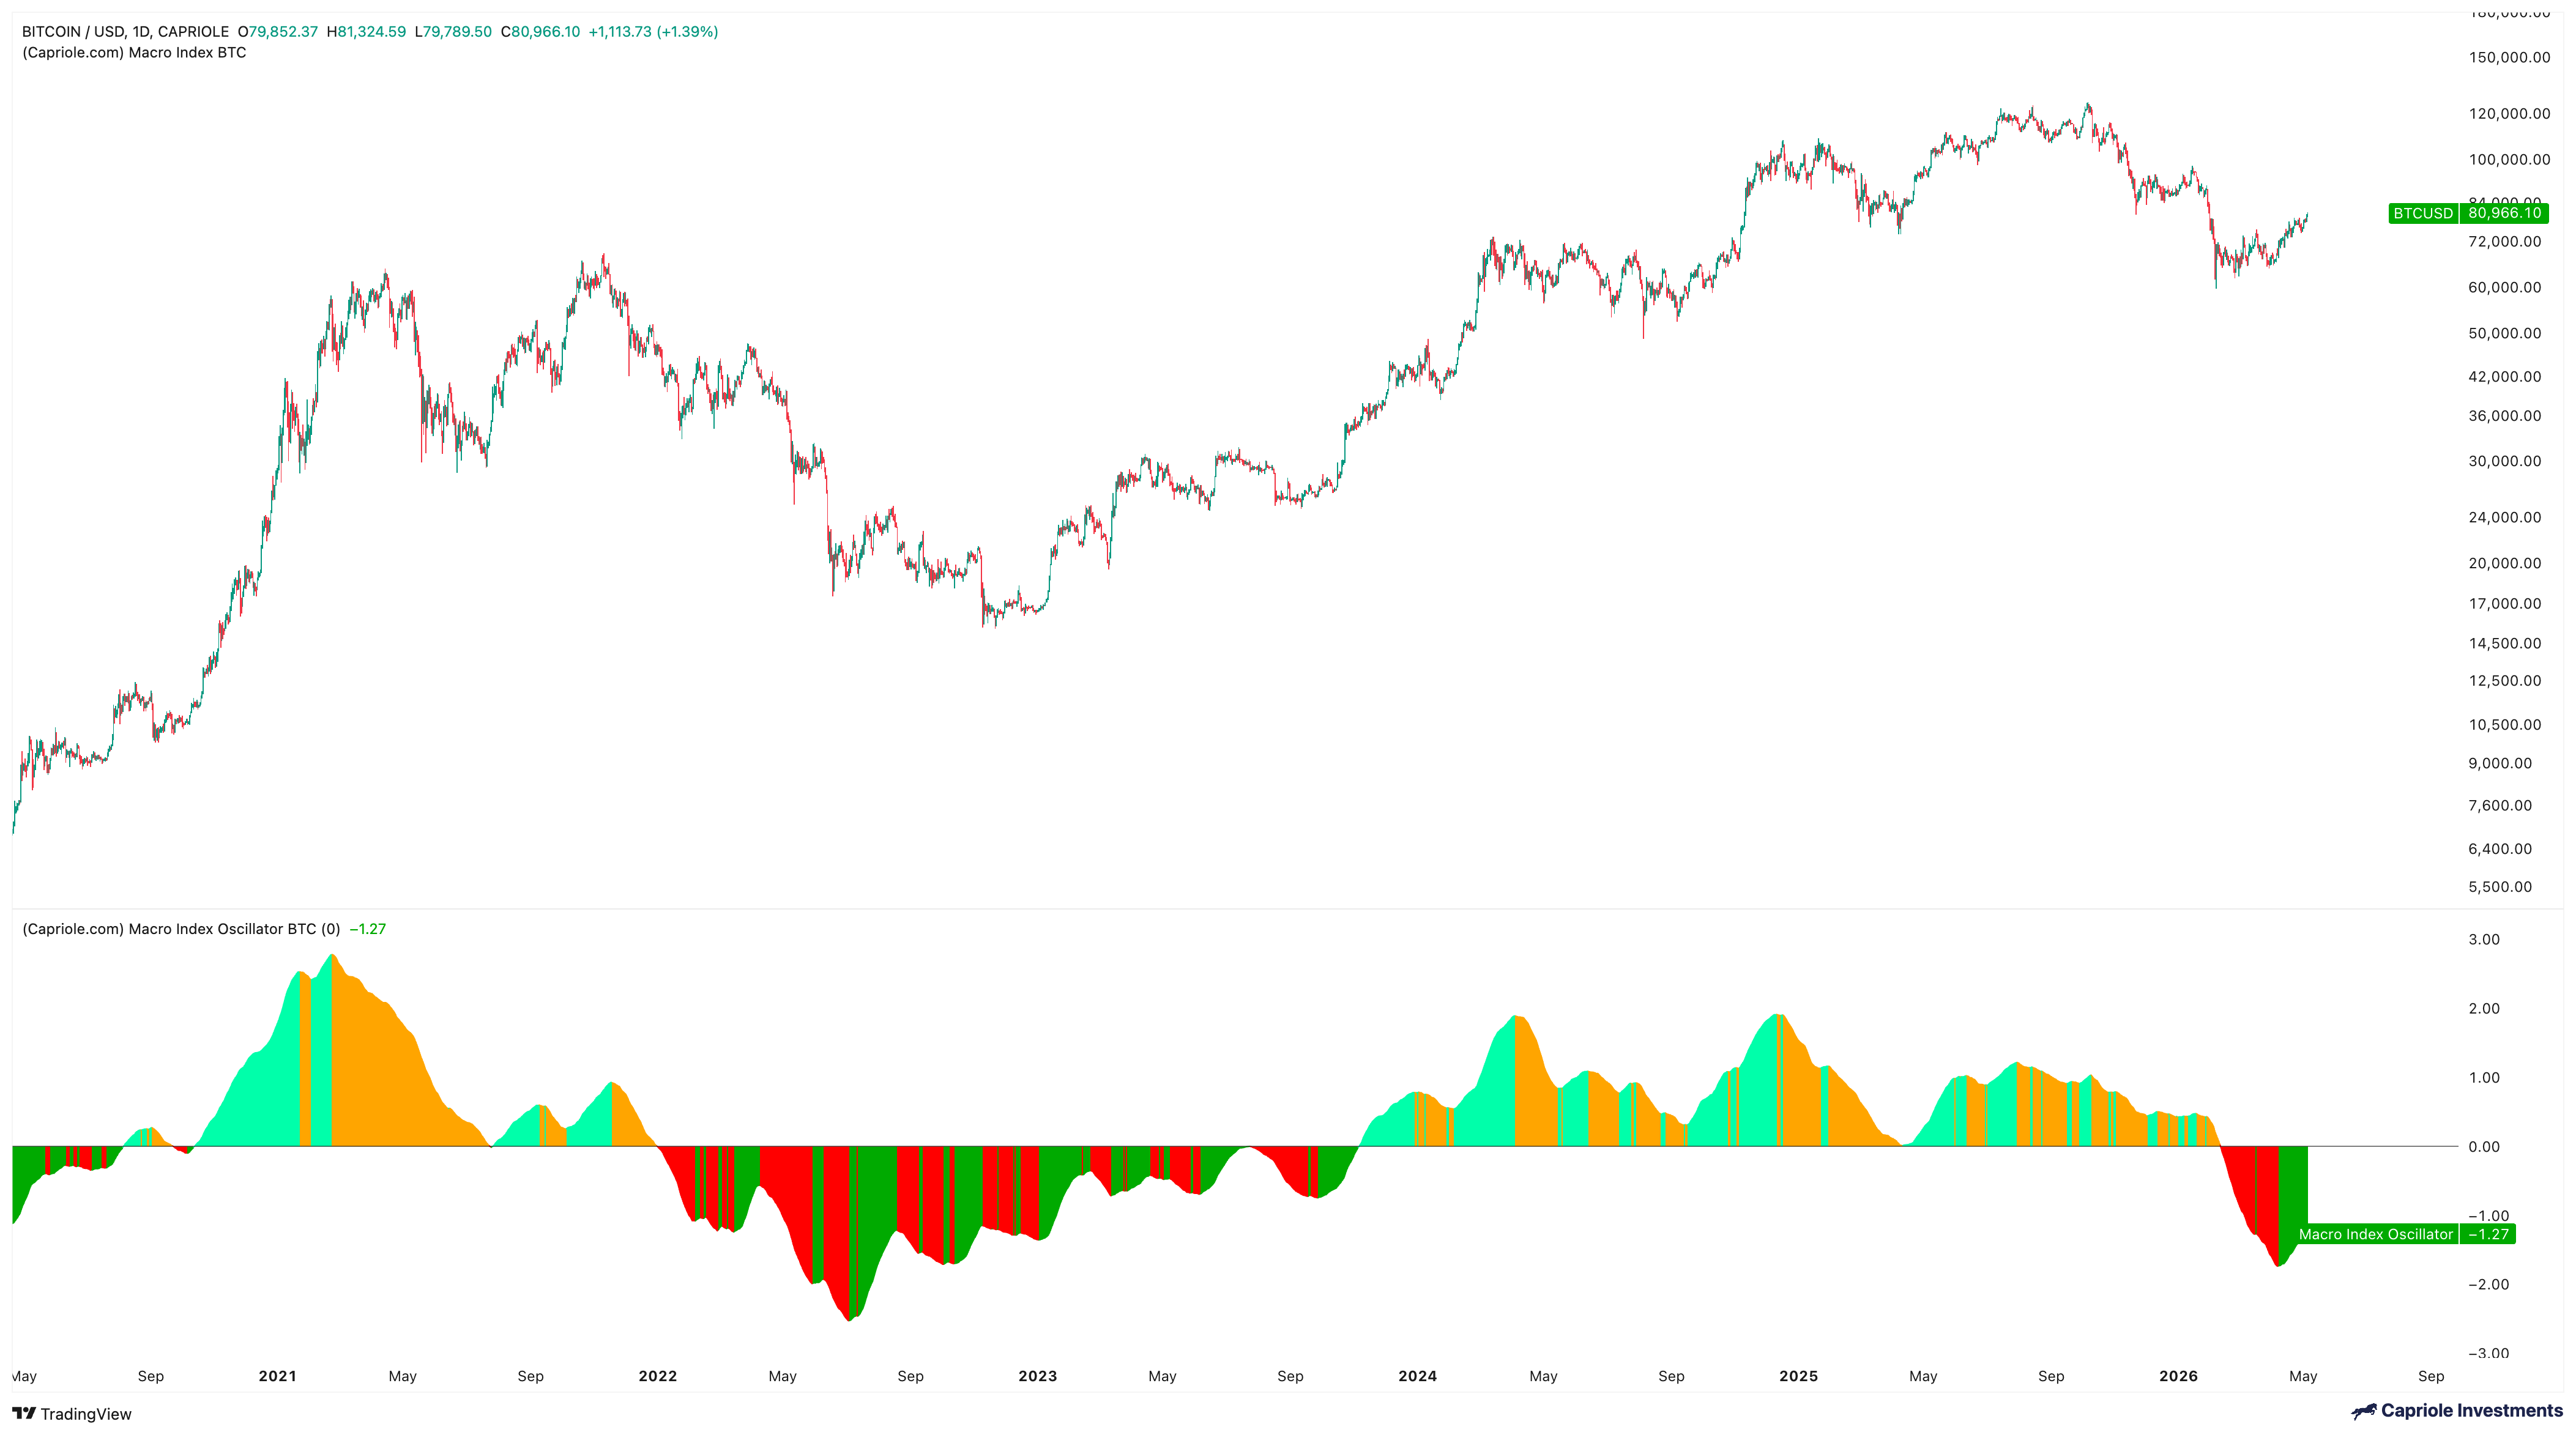
Macro Index is our fundamentals only Bitcoin model, tracking over 200 on-chain and macro market data points it provides our preferred aggregate view of fundamental data for Bitcoin. Macro Index also flipped bullish a few weeks ago at around $71K. It’s now in “recovery” mode and Macro Index trends tend to be sticky.
EQUITIES
Tl;dr:
The classic quite strong market strategy is risk-on and long
Advance Decline line showing weakness at the highs
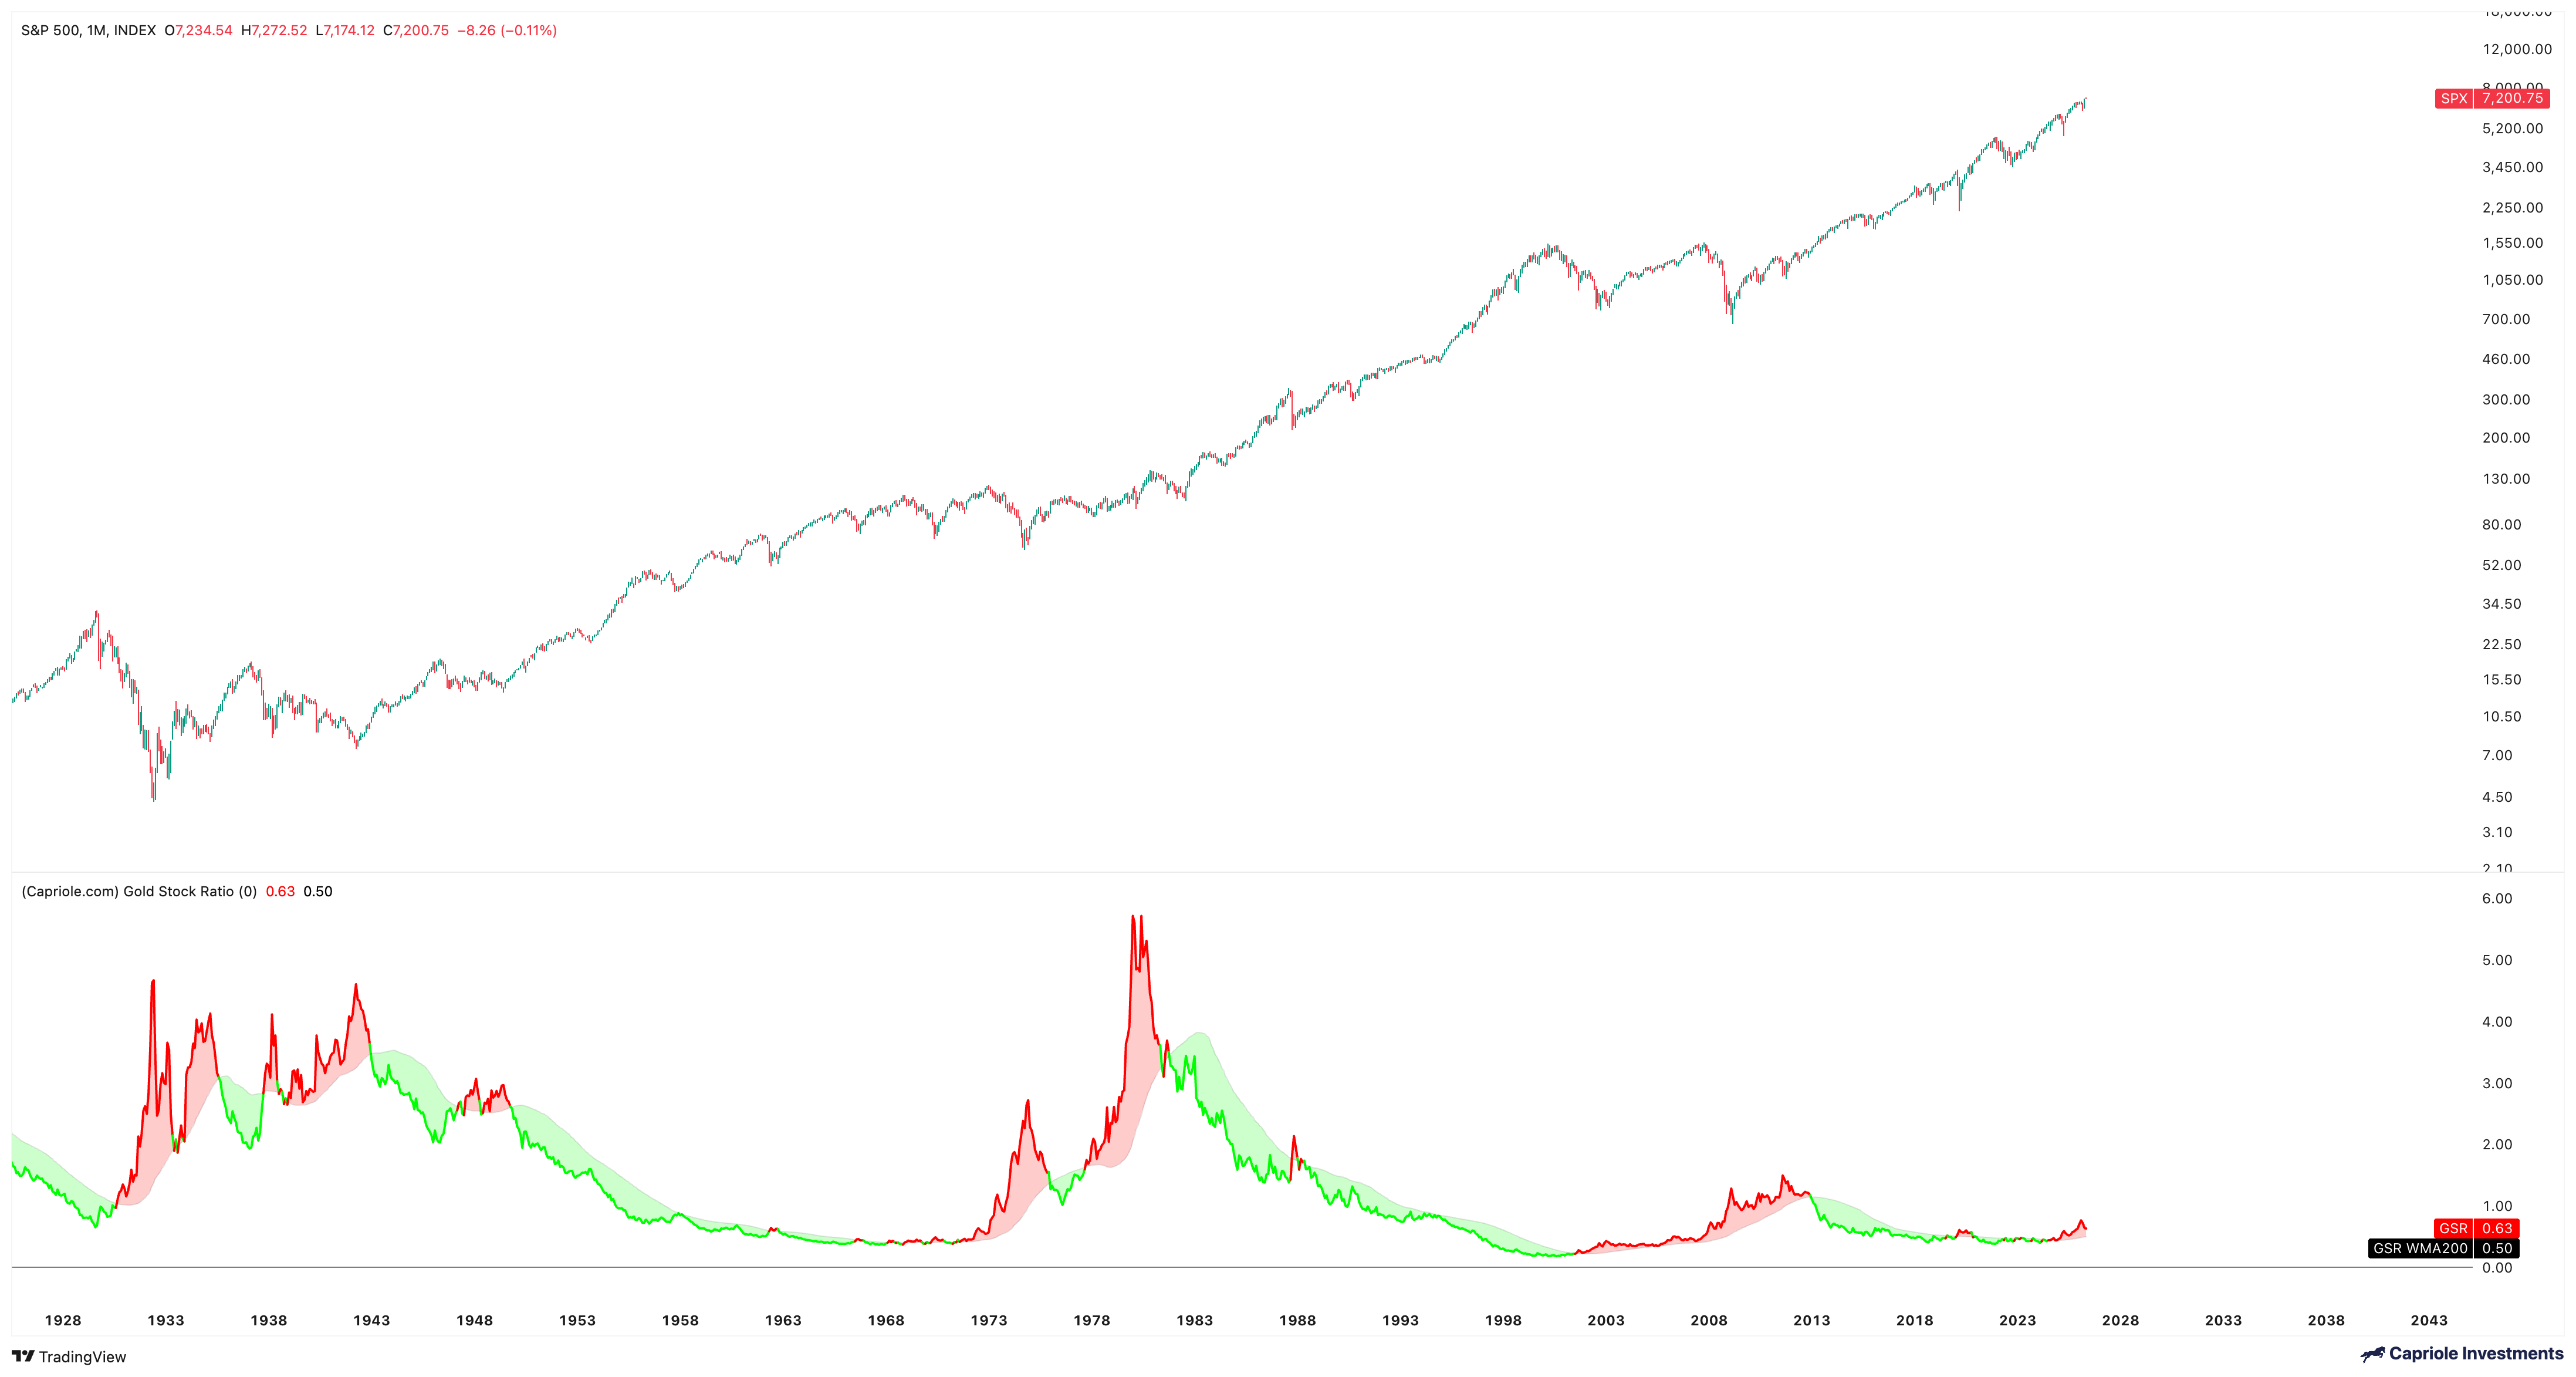
Gold to Stock ratio is bearish for equities, presenting some long-term risk
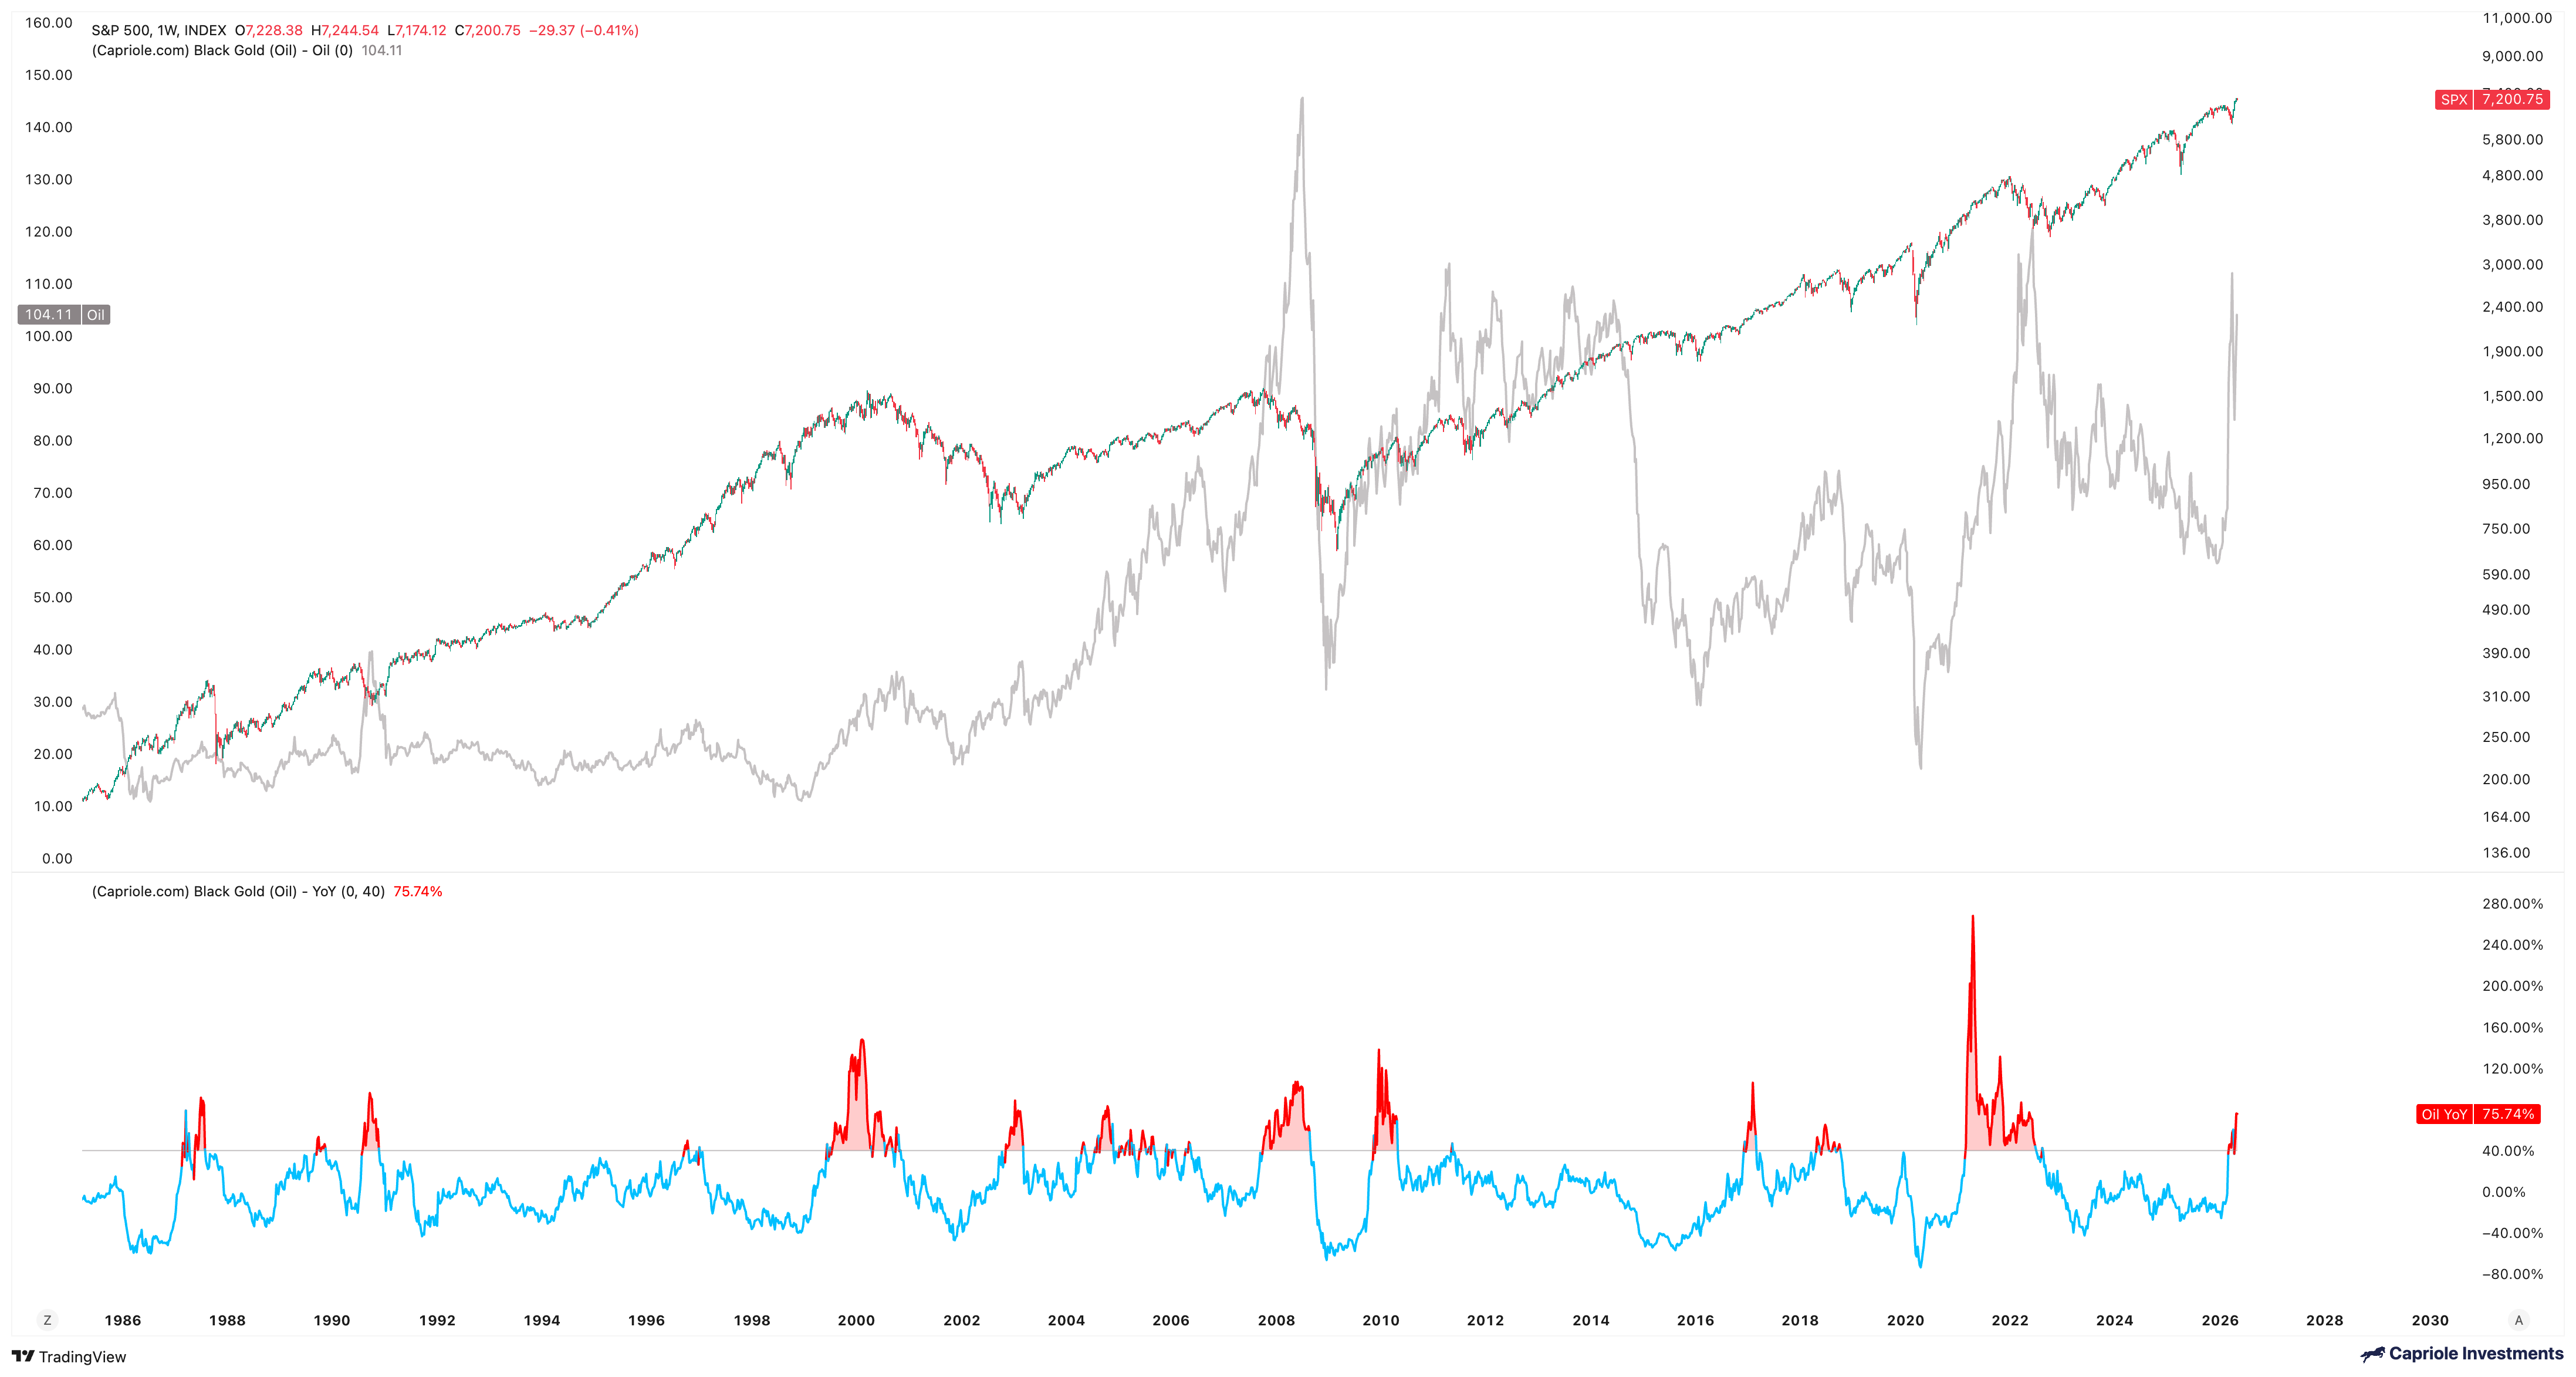
AI earnings beat last week across MAG7. AI is the growth story and tech doesn’t care about high oil prices (so far)
Credit spreads and Vol have collapsed supporting a risk on rally
Sentiment and positioning has flipped to neutral, now it’s time to see if the breakout trend can stick.
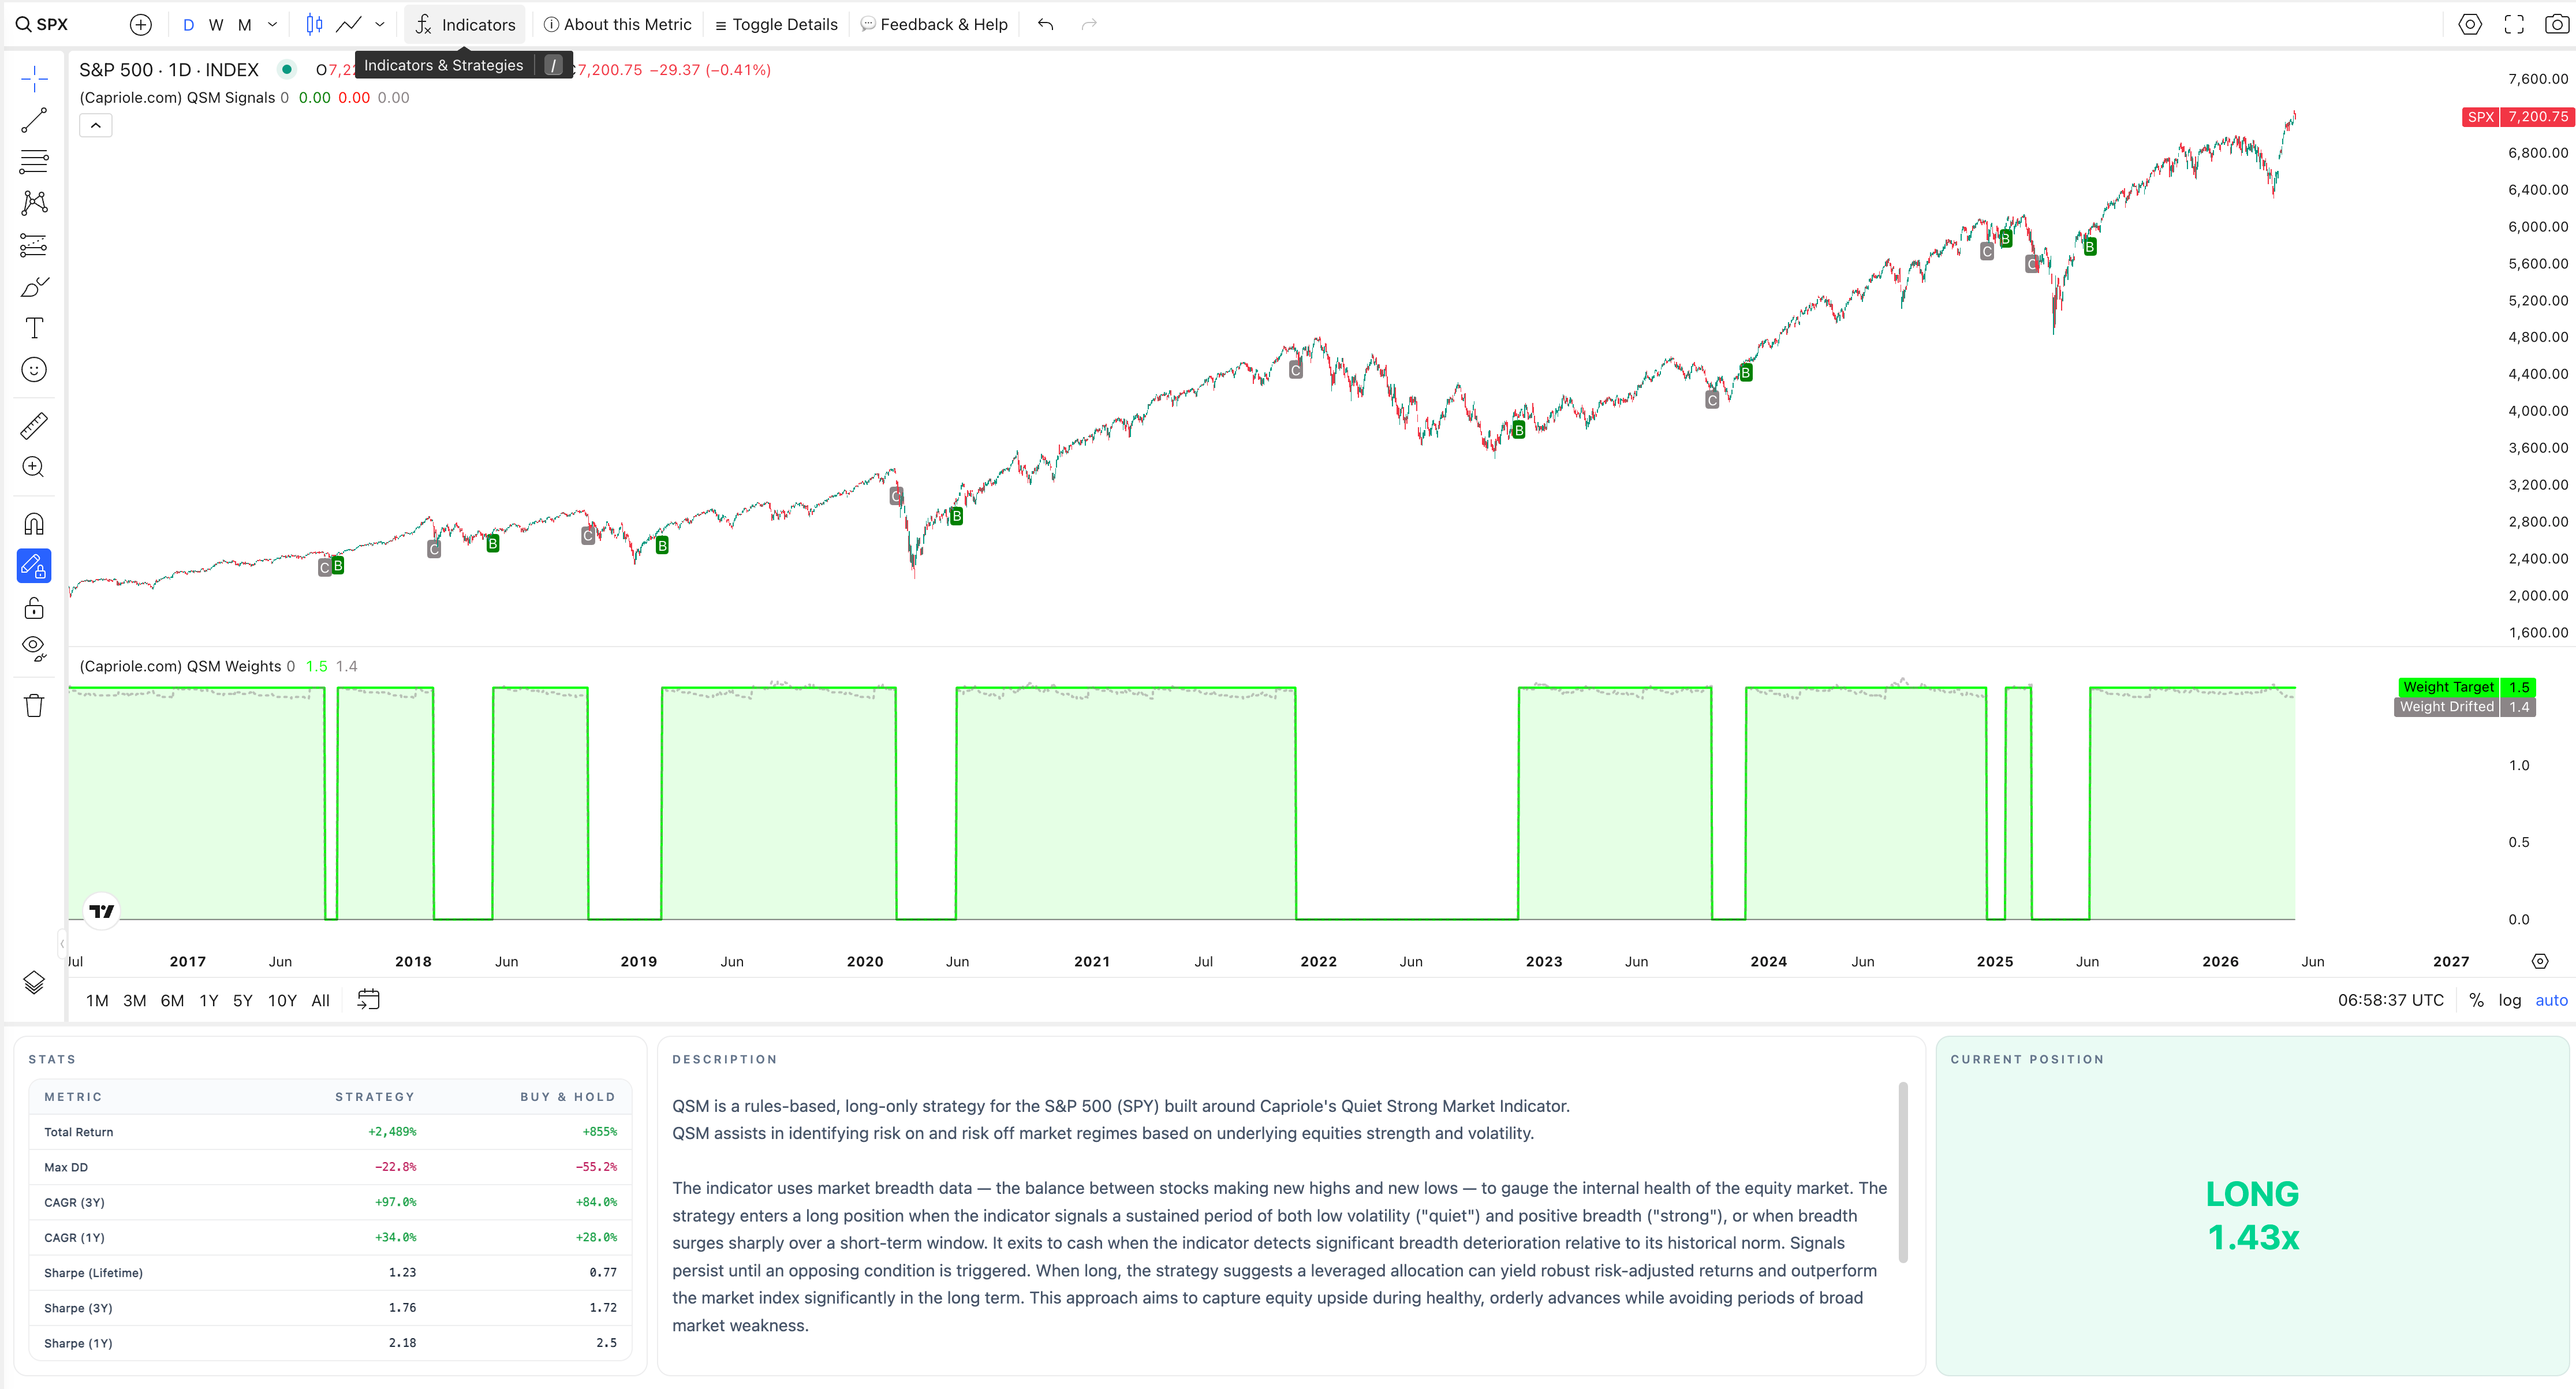
The Quiet strong market weight volatility and market breadth to identify strong trends and manage risk environments. This is a slow moving strategy that won’t protect against lower volatility but does navigate big trends well. It’s still risk-on equities today.
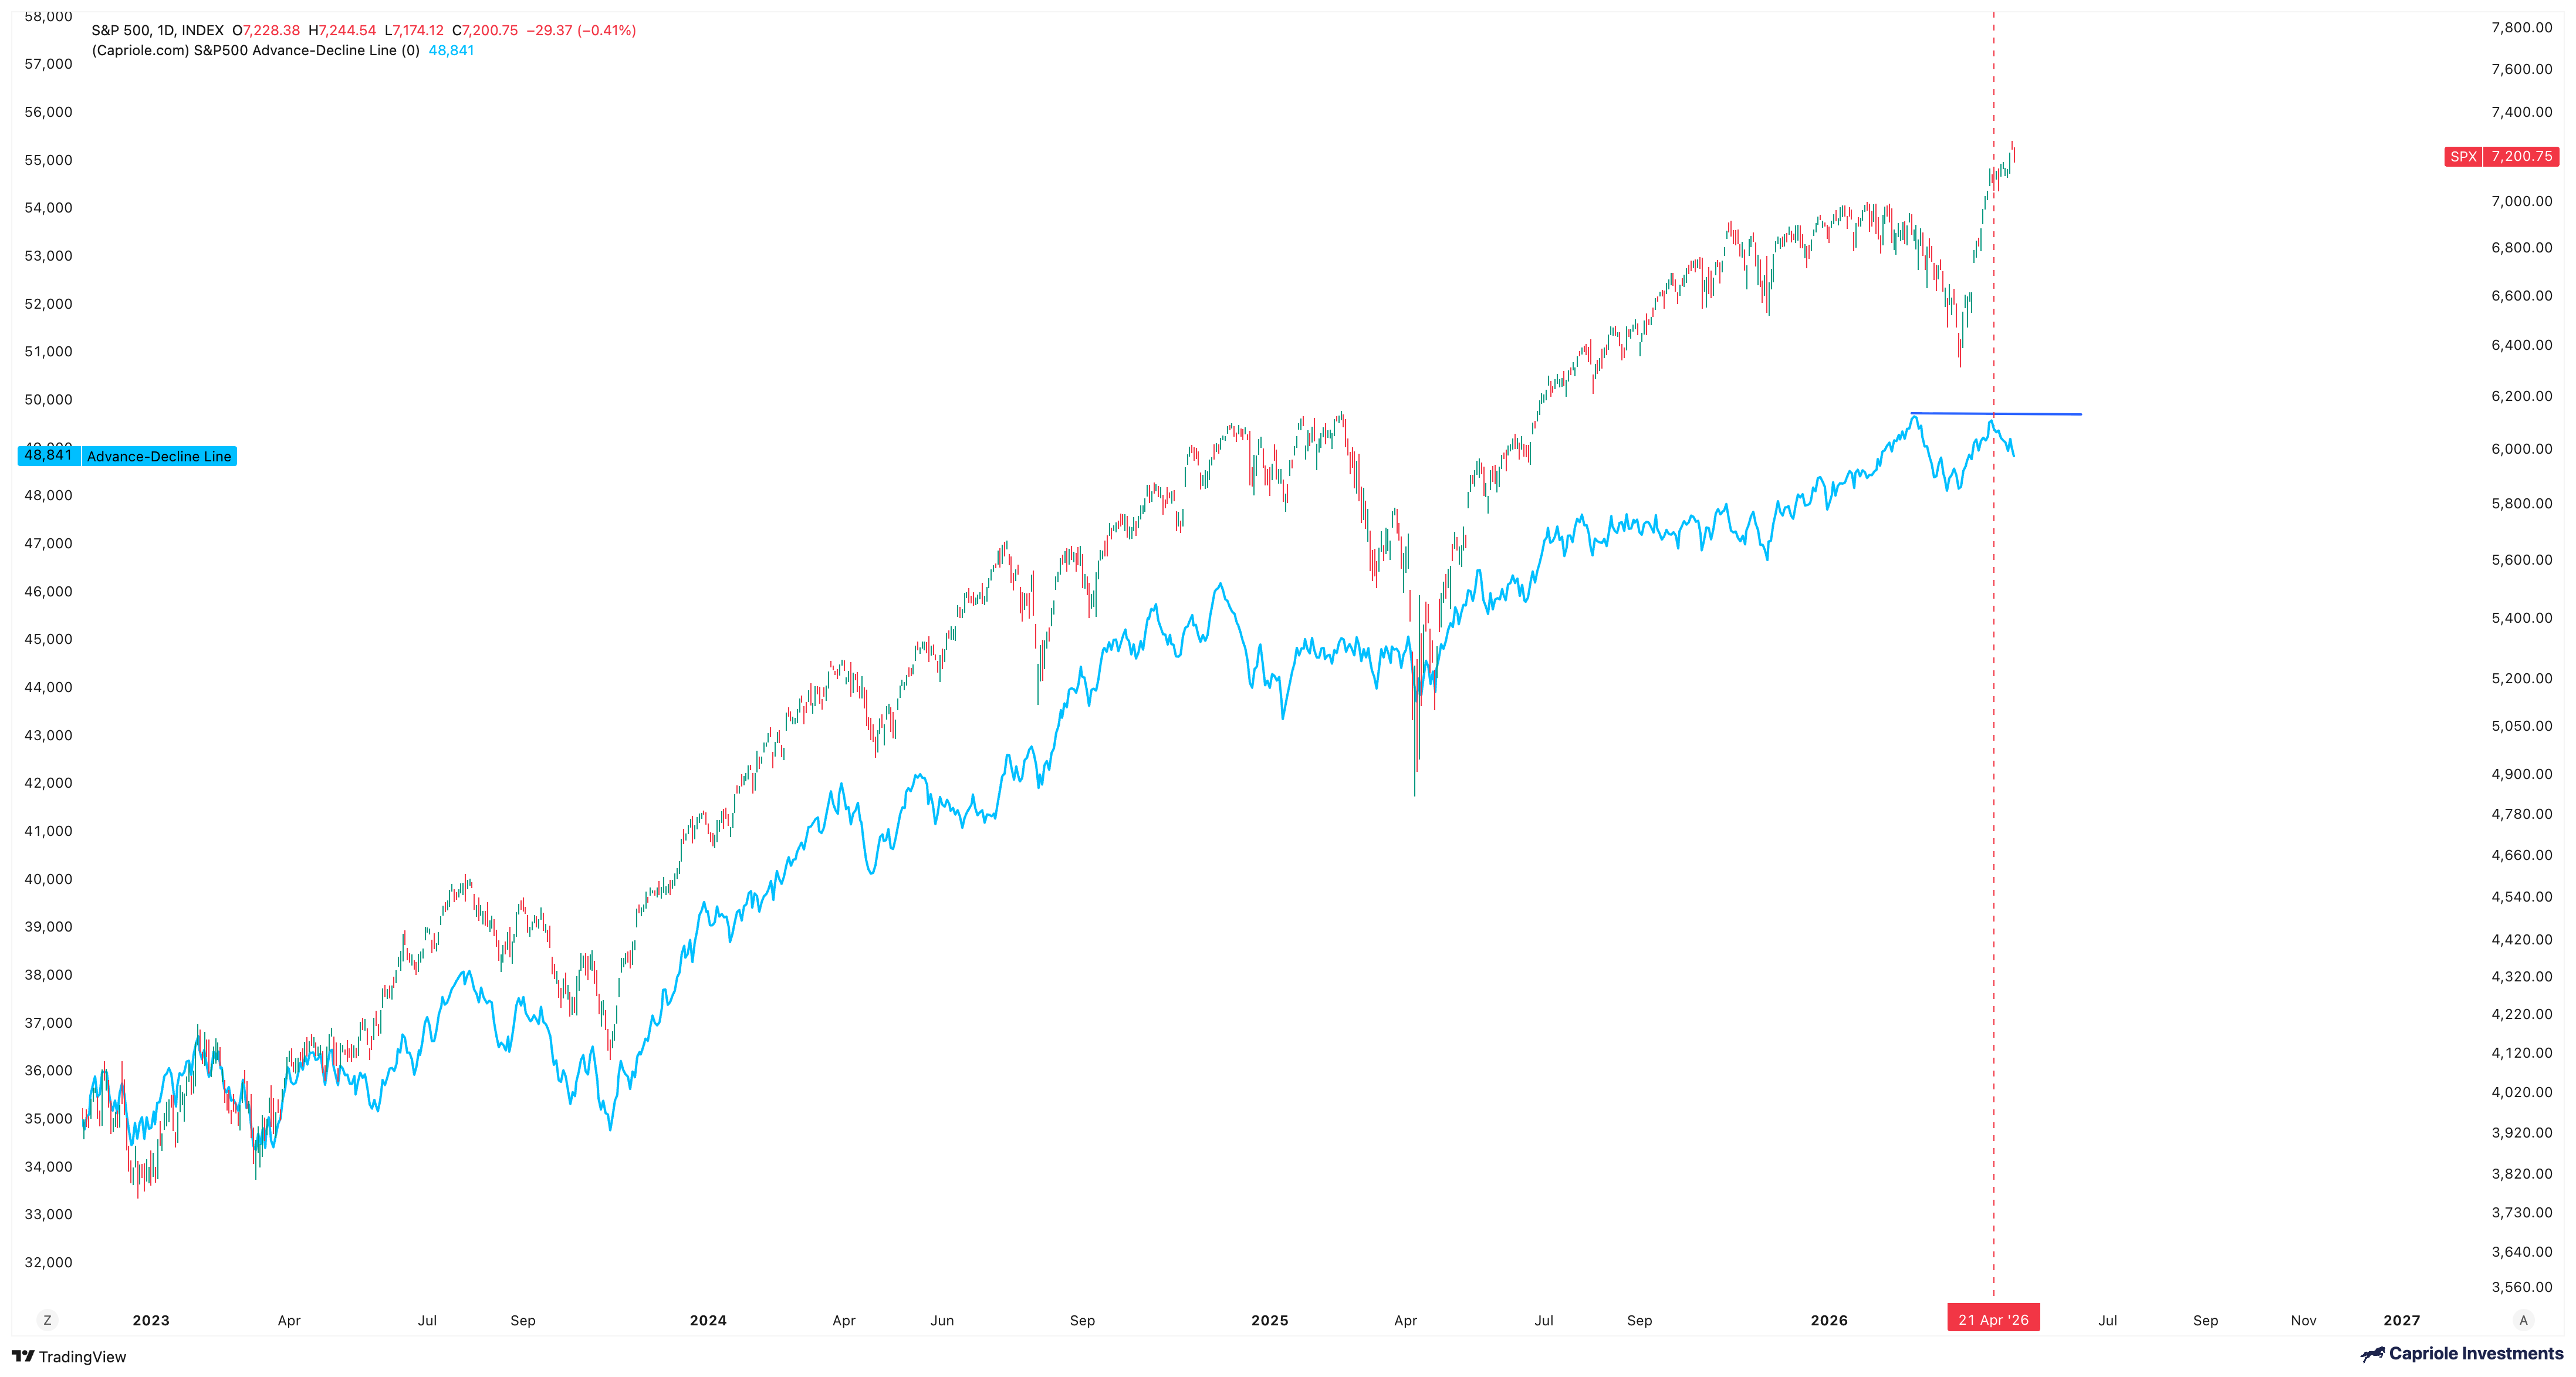
The Advance Decline line broke down and failed to continue higher on the recent breakout. This could be a short-term blip, but if the AD line continues to stall here it does suggest more widespread issues across the S&P 500, perhaps high oil prices are starting to squeeze the tail assets. Definitely a risk factor to watch. Ideally we see the AD Line break out and up over the coming weeks.
High oil prices remain a key risk to monitor as the Iran war continues. Sometimes it’s a false flag but often it captures major risk off events well. The key with high oil prices is duration. The longer we remain higher, the more risk builds up. This months push back to the highs is not ideal. But 1 or 2 months of high prices (like we’ve had) doesn’t cut it, Risk accrues with oil high for year(s).
For a century, a breakout in the Gold stock ratio has been a red flag for equities. It has a phenomenal hit rate. However, Gold has struggled for the last few months, but as long as this Gold relative strength trend holds (as it is today), we must be alert for equities risk.
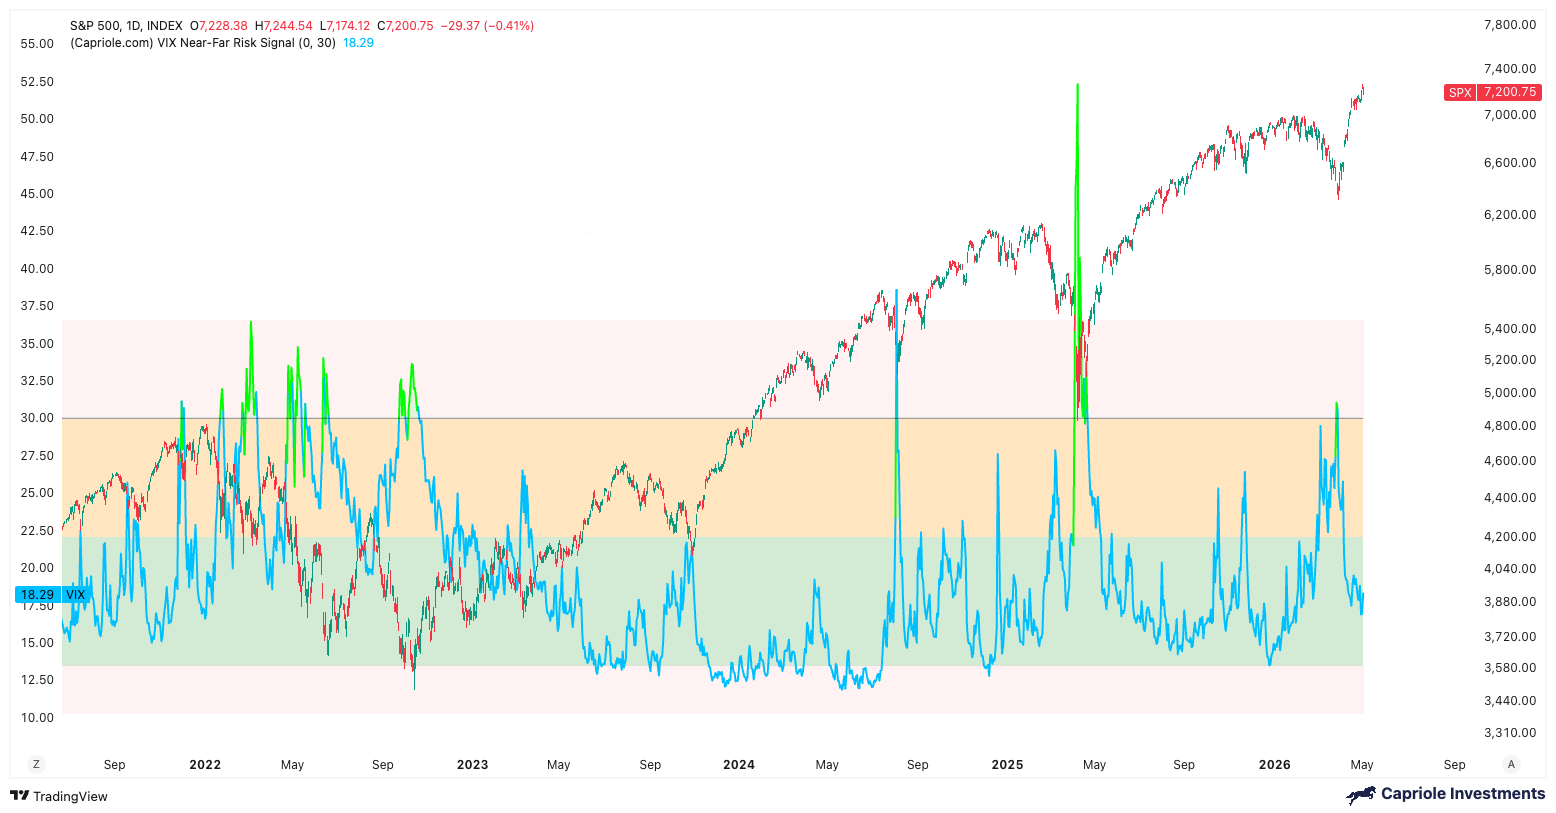
VIX is right in the sweat spot today. It is also supported by collapsing credit spreads. Broadly you can slice the VIX into the following zones (see below chart). VIX above 30 represent fear and is a sign of panic, the emergence out of which (VIX cutting back below 30) is bullish. We just saw this a month ago.
The Orange zone, especially with growing VIX, is a warning sign for price volatility ahead. Relatively low VIX readings (like where we are today) are strong risk on zones which are often the backdrop to the meat of major equities bull markets. That said when VIX gets too low, it can represent complacency and again becomes a warning sign, but we are far from that today.
In short, VIX and credit spreads are supportive of the current breakout trend.
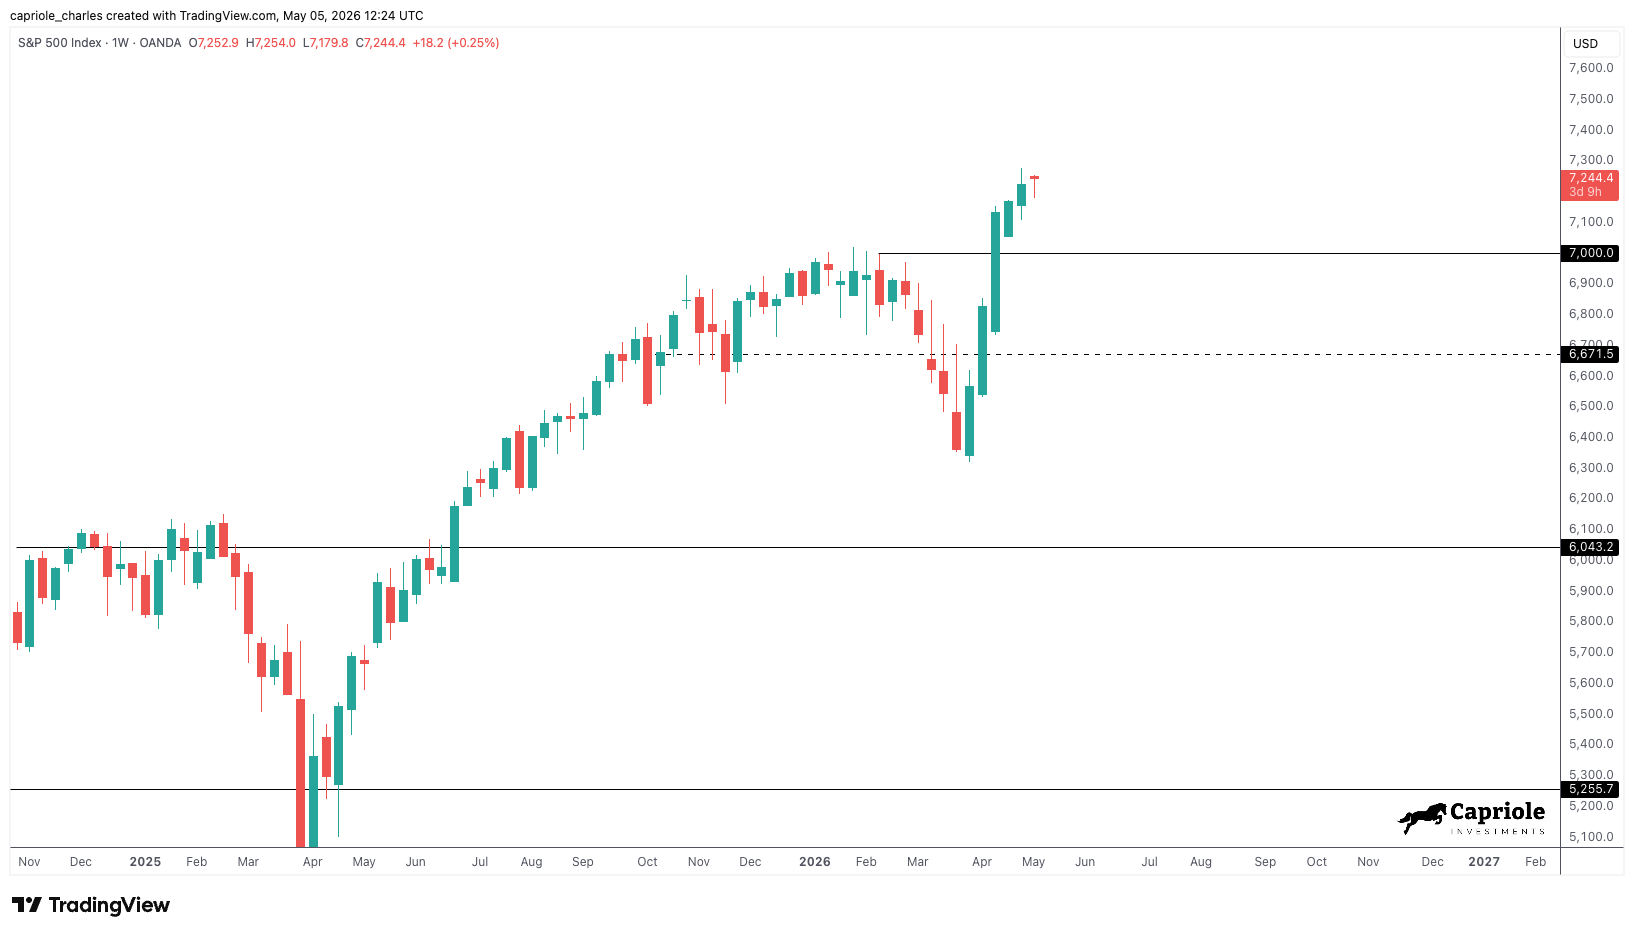
Technicals are again helpful here because we have just printed a fresh S&P 500 all time high breakout. The backdrop is also important. This ATH occured in the midst of war, the Strait of Hormuz, Blockades, soaring oil prices, and terrible market sentiment. When price responds with strength to bad news, it’s a powerful bullish signal (same goes for Bitcoin). So until the most recent weekly resistance at 7000 fails, its risk-on for the S&P 500. A weekly close below 7000 would turn the technicals pretty ugly, until then, it makes sense to ride the wave.
BOTTOM LINE
Bitcoin looks incredibly strong here. It’s also supported by relative strength against all markets, having bottomed and outperformed since the Iran war started. We see consistent strength across technical and fundamental data for Bitcoin today.
Equities are more nuanced, with a few warning flags flashing, but those are mostly longer-term warning signs, which would require more bearish near-term confluence to really get behind. Furthermore, we have a fresh and nearby technical line in the sand at 7000, which can be used to abandon ship should it fail.
Until then, the trend is your friend.
We just might be back.
- Charles Edwards
C A P R I O L E I N V E S T M E N T S
Capriole Investments runs a systematic macro fund, utilizing direction long/short models to provide downside protected allocation to the highest growth exponential age asset classes including: Bitcoin, quantum computing and critical commodities like gold. As of publication (15 April 2026) Capriole has a 55%+ average annual return net of fees since inception in 2019. For more details see Capriole.com
DISCLAIMER
The information contained here is provided to you solely for informational purposes only. Opinions and projections included are provided as of the date of publication, may prove to be inaccurate and are subject to change without notice. This information does not constitute an offering. Prospective investors should not treat these materials as advice regarding legal, tax, or investment matters. No recommendations are made to invest in Capriole Investments Limited nor any other investment. Past performance is no guarantee of future results. Investing in general involves risks. Additional risks are outlined at www.capriole.com/legal. Decisions or actions based on the information provided are at the reader’s own account and risk.
self fulfilling prophecy by looking at the onchain data , the SOPR close up and below 1 multiple times during the bear market as well, you won’t be able to find the bottom, its like 50/50 chance. lol
What about the kind of imminent quantum rhetoric now? Or was it just a bottom FUD topic?